Inputs Y-Factor
Calibration — noise source only
Noise Source OFF Nsrc,off
OFF
dBm
Noise Source ON Nsrc,on
ON
dBm
Measurement — noise source + DUT
Noise Source OFF Ndut,off
OFF
dBm
Noise Source ON Ndut,on
ON
dBm
Noise Source Parameters
Excess Noise Ratio ENRdB
dB · from noise source
Result
dB DUT Noise Figure
Reference & Examples
Application Note
1MA178 · The Y-Factor Technique for Noise Figure Measurements
↗ Open PDF
Example Measurements
Calibration — Noise Source Only No DUT in path
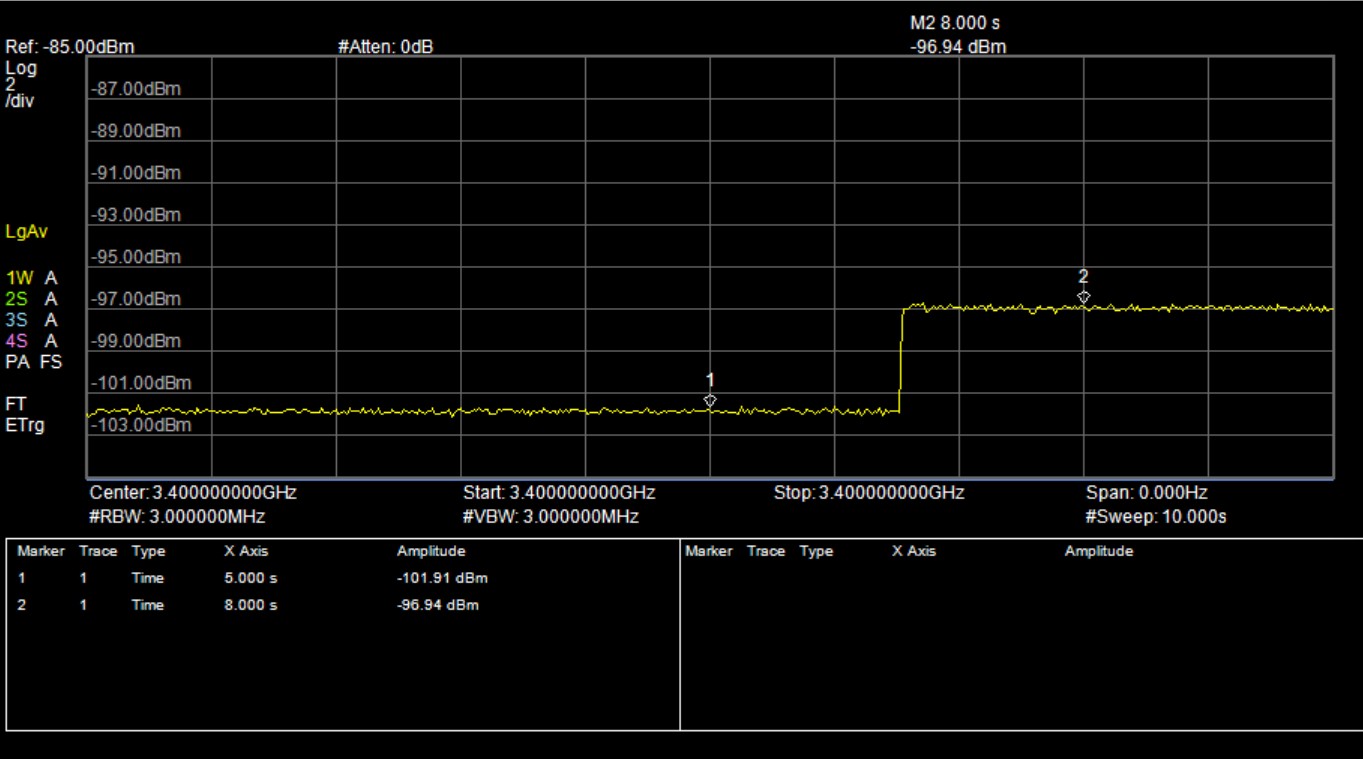
Spectrum analyzer screenshot showing noise source only measurement with two markers indicating OFF and ON states
Marker 1 Noise Source OFF — average noise power with source in cold state (Nsrc,off)
Marker 2 Noise Source ON — average noise power with source biased (Nsrc,on)
10 s sweep time captures both ON and OFF states of the noise source in a single trace
Measurement — Noise Source + DUT DUT in path
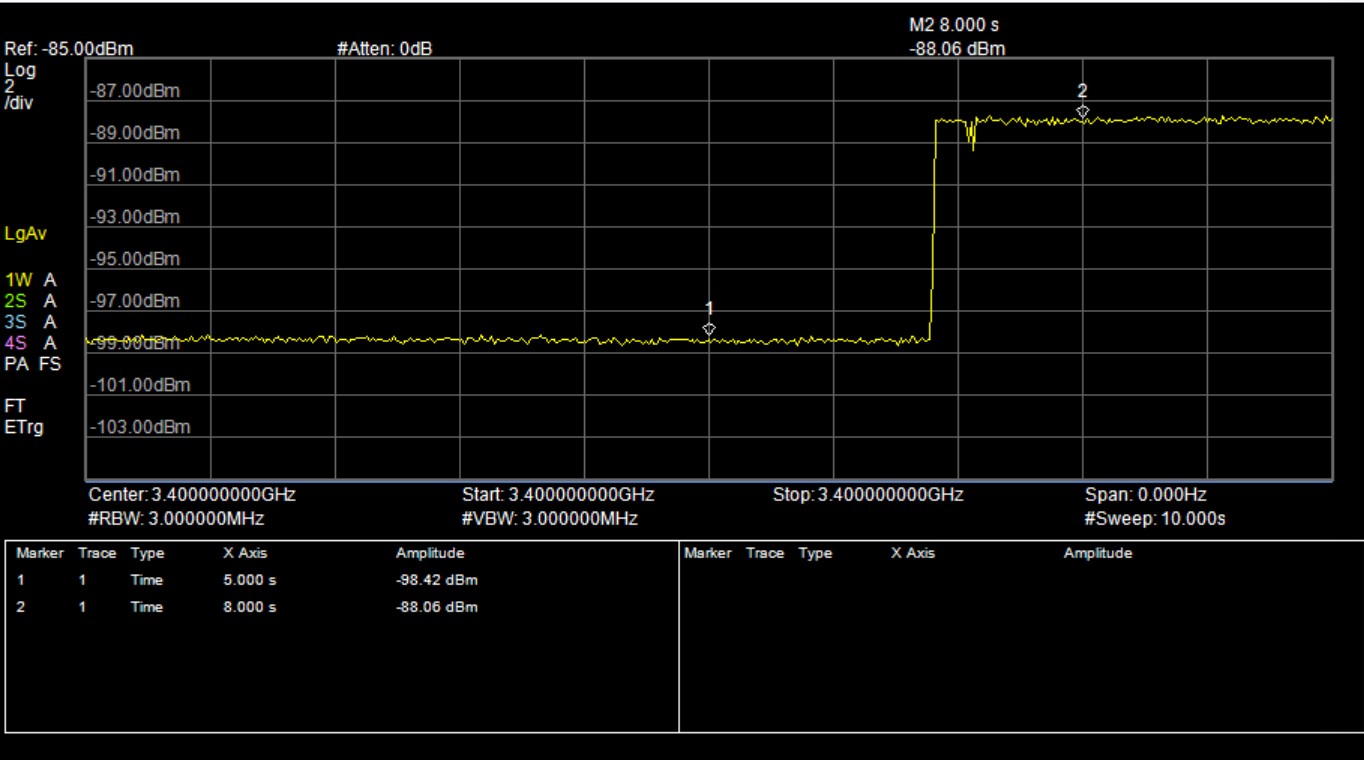
Spectrum analyzer screenshot showing noise source and DUT measurement with two markers indicating OFF and ON states
Marker 1 Noise Source OFF + DUT — noise floor through DUT, source cold (Ndut,off)
Marker 2 Noise Source ON + DUT — amplified noise through DUT, source biased (Ndut,on)
10 s sweep time captures both ON and OFF states of the noise source in a single trace
Ad Space

What Is Noise Figure?

Noise figure (NF) is a measure of how much a device — such as an amplifier, mixer, or LNA — degrades the signal-to-noise ratio (SNR) of a signal passing through it. It is expressed in decibels (dB), where 0 dB represents a theoretically perfect, noiseless device. In practice, all real RF components add some amount of thermal noise, and the noise figure quantifies this degradation.

A low noise figure is critical in receiver front-end design, satellite communications, radio astronomy, cellular base stations, and any application where weak signals must be detected reliably. For example, a low-noise amplifier (LNA) with a noise figure of 1.5 dB will produce a much cleaner output than one rated at 4 dB, directly improving system sensitivity and range.

How the Y-Factor Method Works

The Y-Factor method is the most widely used technique for measuring noise figure with a spectrum analyzer. It works by comparing the output noise power of a device under two conditions: with a calibrated noise source switched OFF (cold state) and switched ON (hot state).

The ratio of these two power levels is called the Y-factor. Combined with the known Excess Noise Ratio (ENR) of the noise source, the Y-factor allows the noise figure to be calculated directly. This calculator implements the full procedure described in the Rohde & Schwarz application note 1MA178, including a second-stage correction that removes the spectrum analyzer's own noise contribution from the result using the Friis cascade equation.

The second-stage correction is performed automatically using the calibration measurements (noise source only, no DUT). No additional input is required from the user.

What You Need

Step-by-Step Measurement Procedure

  1. Connect the noise source directly to the spectrum analyzer input (no DUT). Set the sweep time to 10 seconds to capture both the ON and OFF states of the noise source in a single trace.
  2. Toggle the noise source OFF and place Marker 1 on the average noise floor. Record this value as Nsrc,off in dBm.
  3. Toggle the noise source ON and place Marker 2 on the elevated noise floor. Record this value as Nsrc,on in dBm. These two readings form the calibration measurement.
  4. Insert the DUT between the noise source and the spectrum analyzer input. Keep all other settings identical.
  5. Toggle the noise source OFF and record the new noise floor as Ndut,off in dBm.
  6. Toggle the noise source ON and record the elevated noise floor as Ndut,on in dBm.
  7. Enter all four power readings and the ENR value from your noise source calibration sheet into the calculator above and click Calculate.